The Data-Driven Edge for California Political Professionals
The most successful campaigns, consultants, and public affairs pros don't fly blind. They use comprehensive data to find their edge. We put that power at your fingertips.
The High Cost of Incomplete Information
Relying on registration numbers alone is a strategic liability. Two districts can look identical on paper but have vastly different political realities. Making critical decisions on this limited data is a gamble.
Eliminate Blind Spots
Go beyond surface-level numbers to see the turnout patterns, voting history, and demographic trends that truly define a district.
Act With Confidence
Build strategy, advise clients, and make endorsements backed by a complete, trustworthy, and instantly accessible dataset.
Gain a Competitive Edge
Leverage the same comprehensive intelligence used by top-tier consultants to give your campaign or cause its best chance to succeed.
See the Strategic Advantage in Action
Watch how political professionals use our platform to build winning strategies.
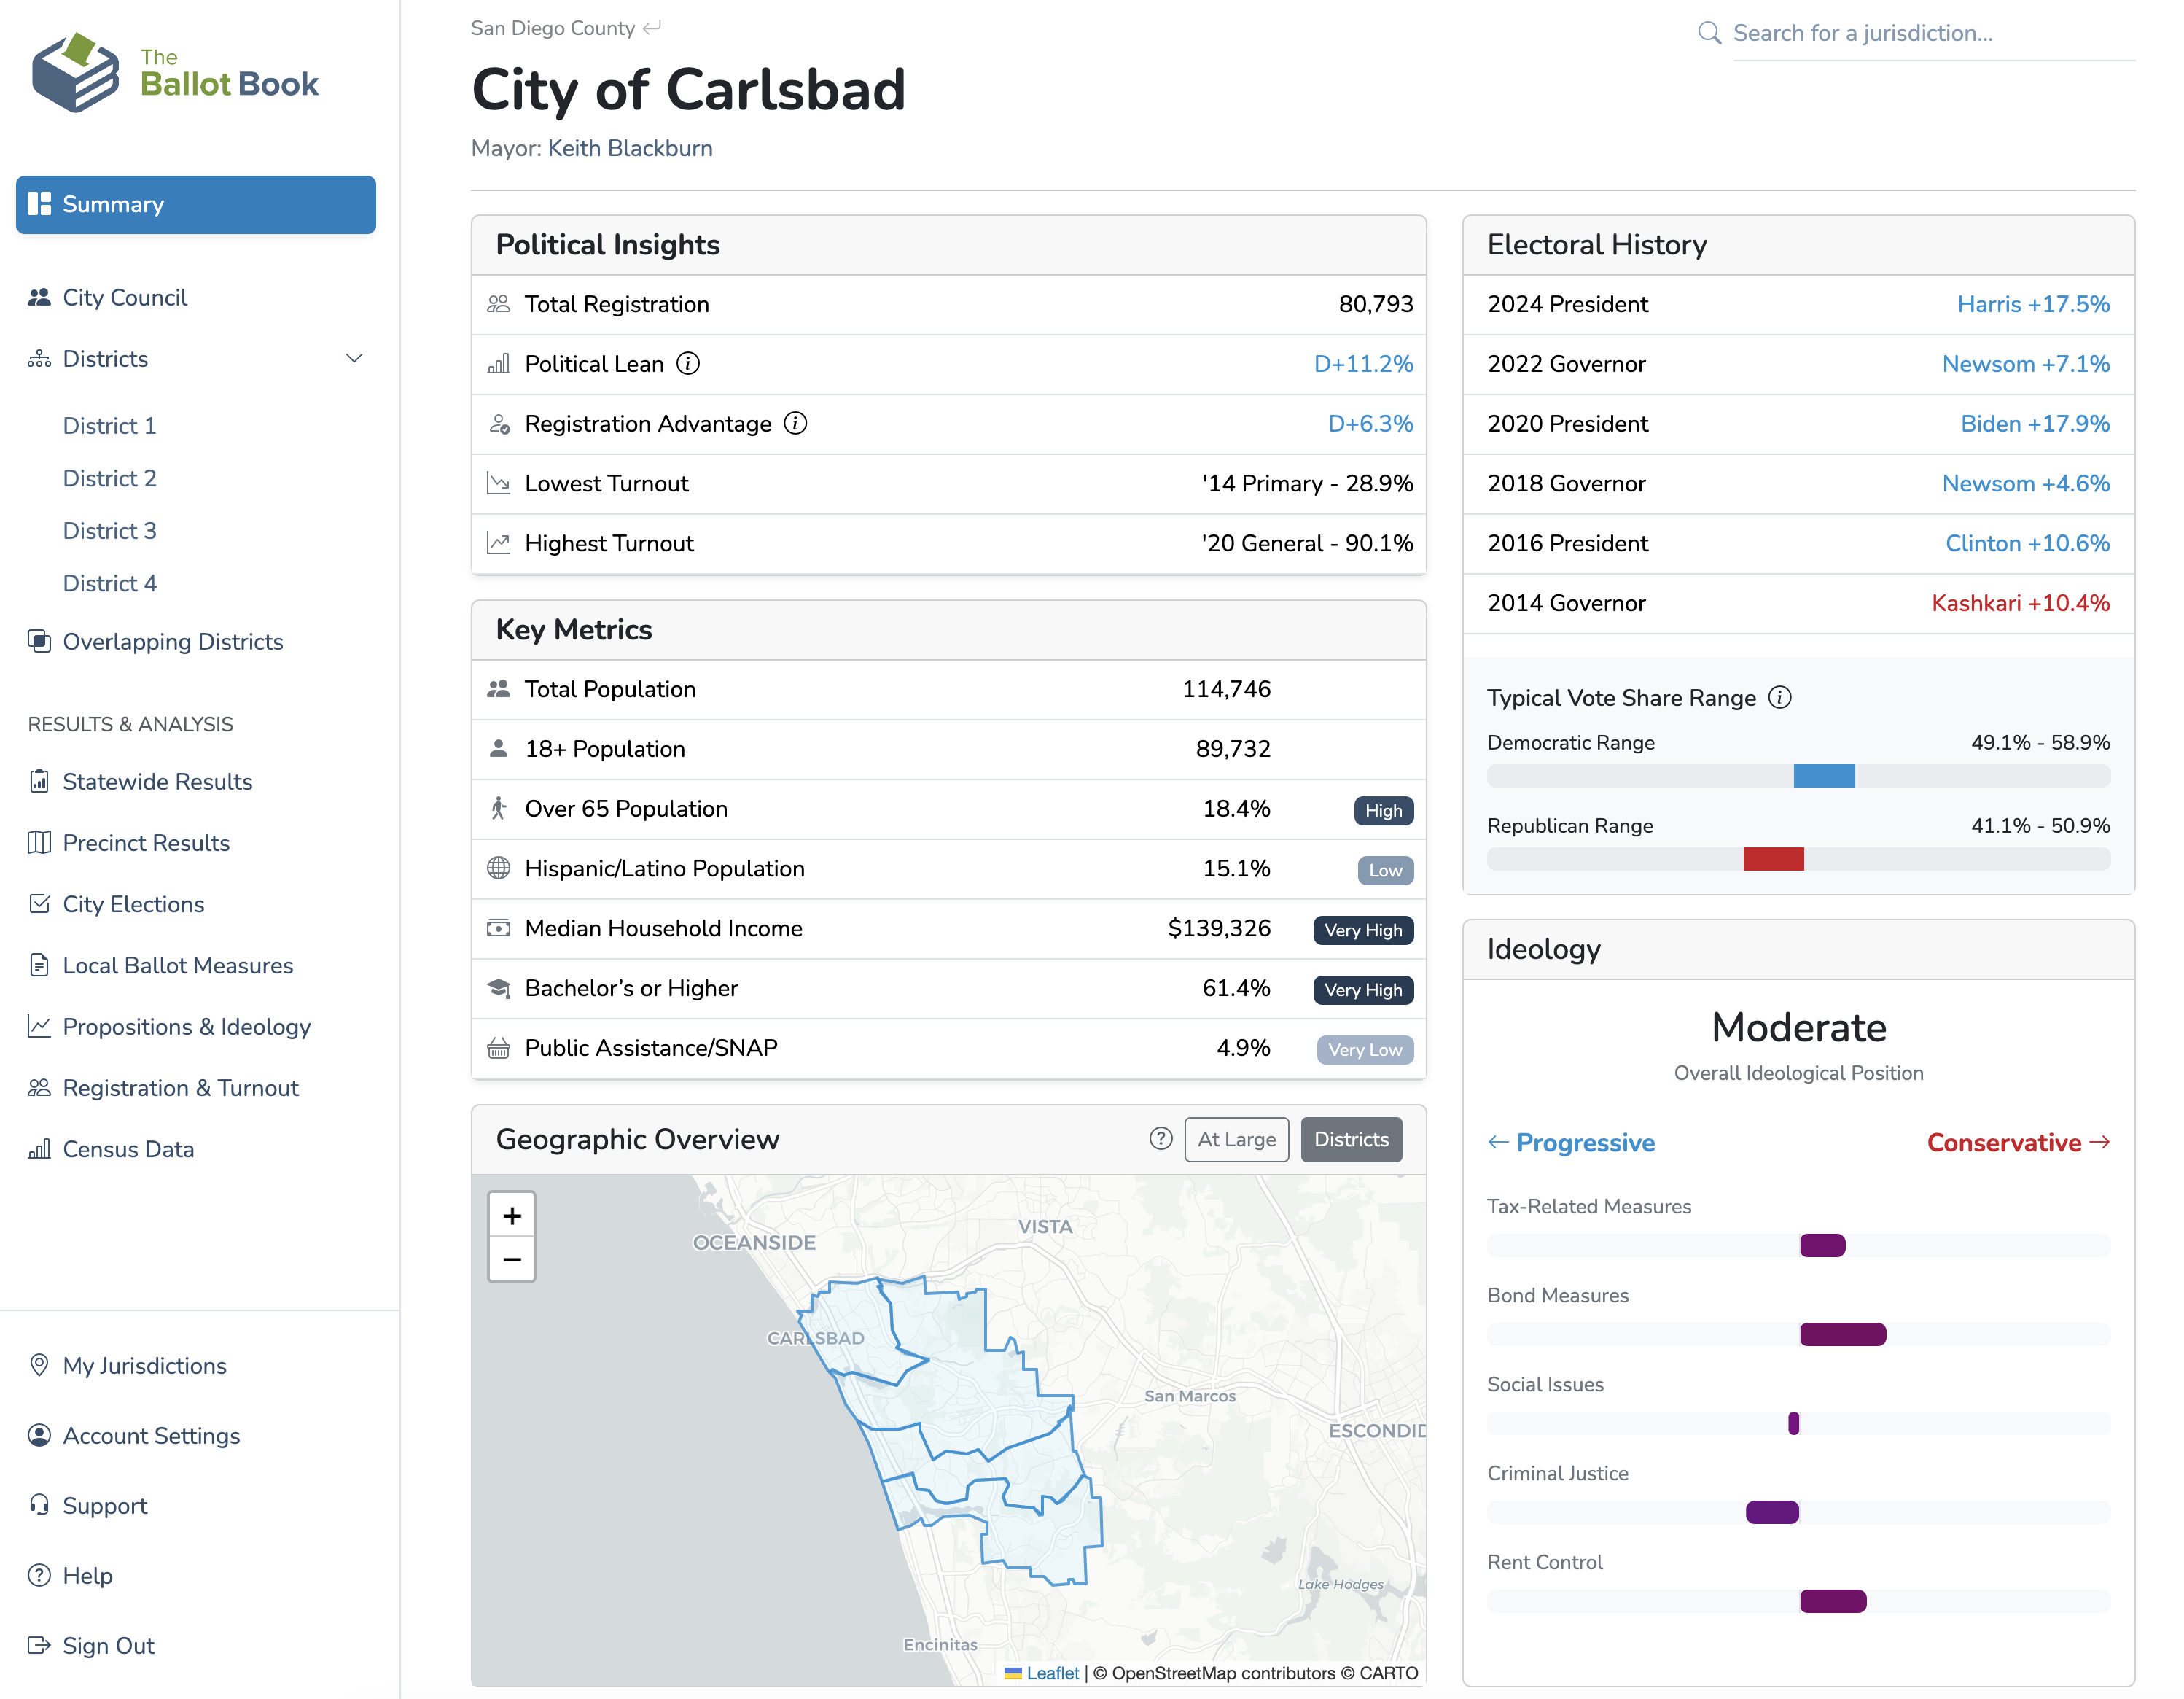
Your District Intelligence Hub
Get a complete strategic overview on a single page. Everything you need to understand a district's political landscape is calculated, organized, and ready.
- Registration & Turnout: See who's registered vs. who actually votes.
- Election Results: Analyze historical performance to find trends and opportunities.
- Demographics: Understand the economic and social factors that influence voters.
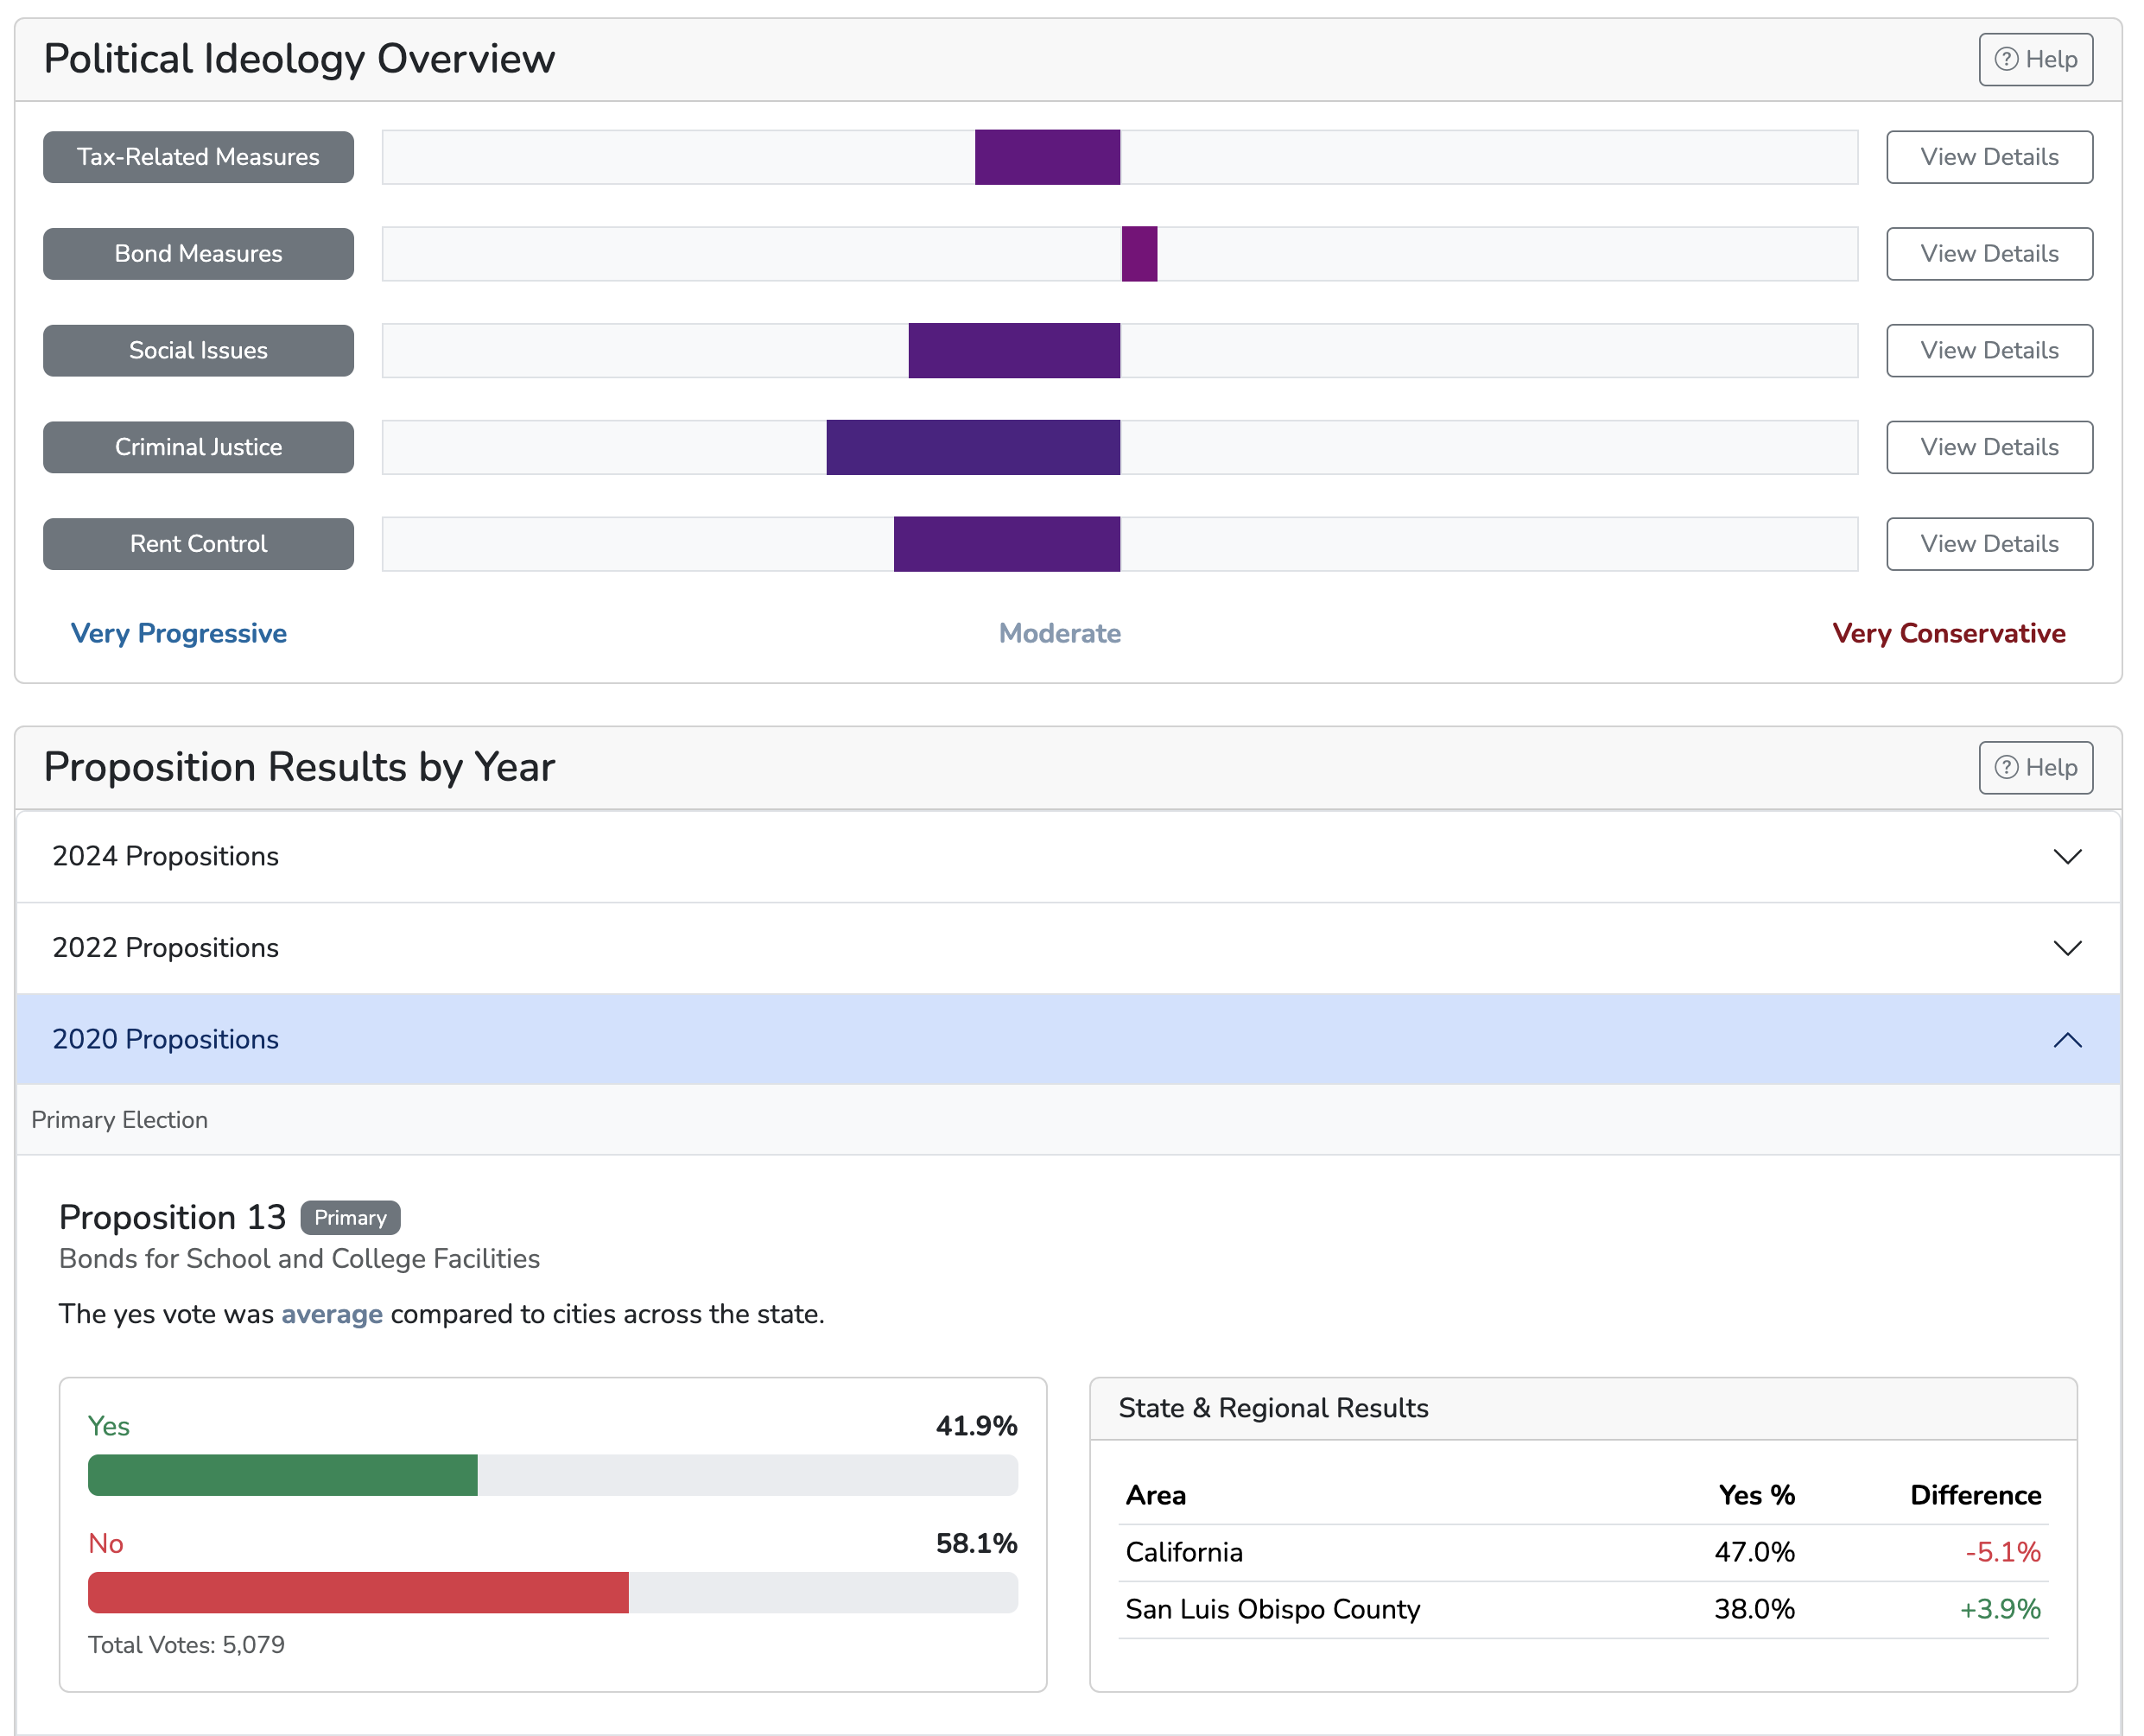
- Ideological Profile: Gauge a district's leanings with proposition voting history.
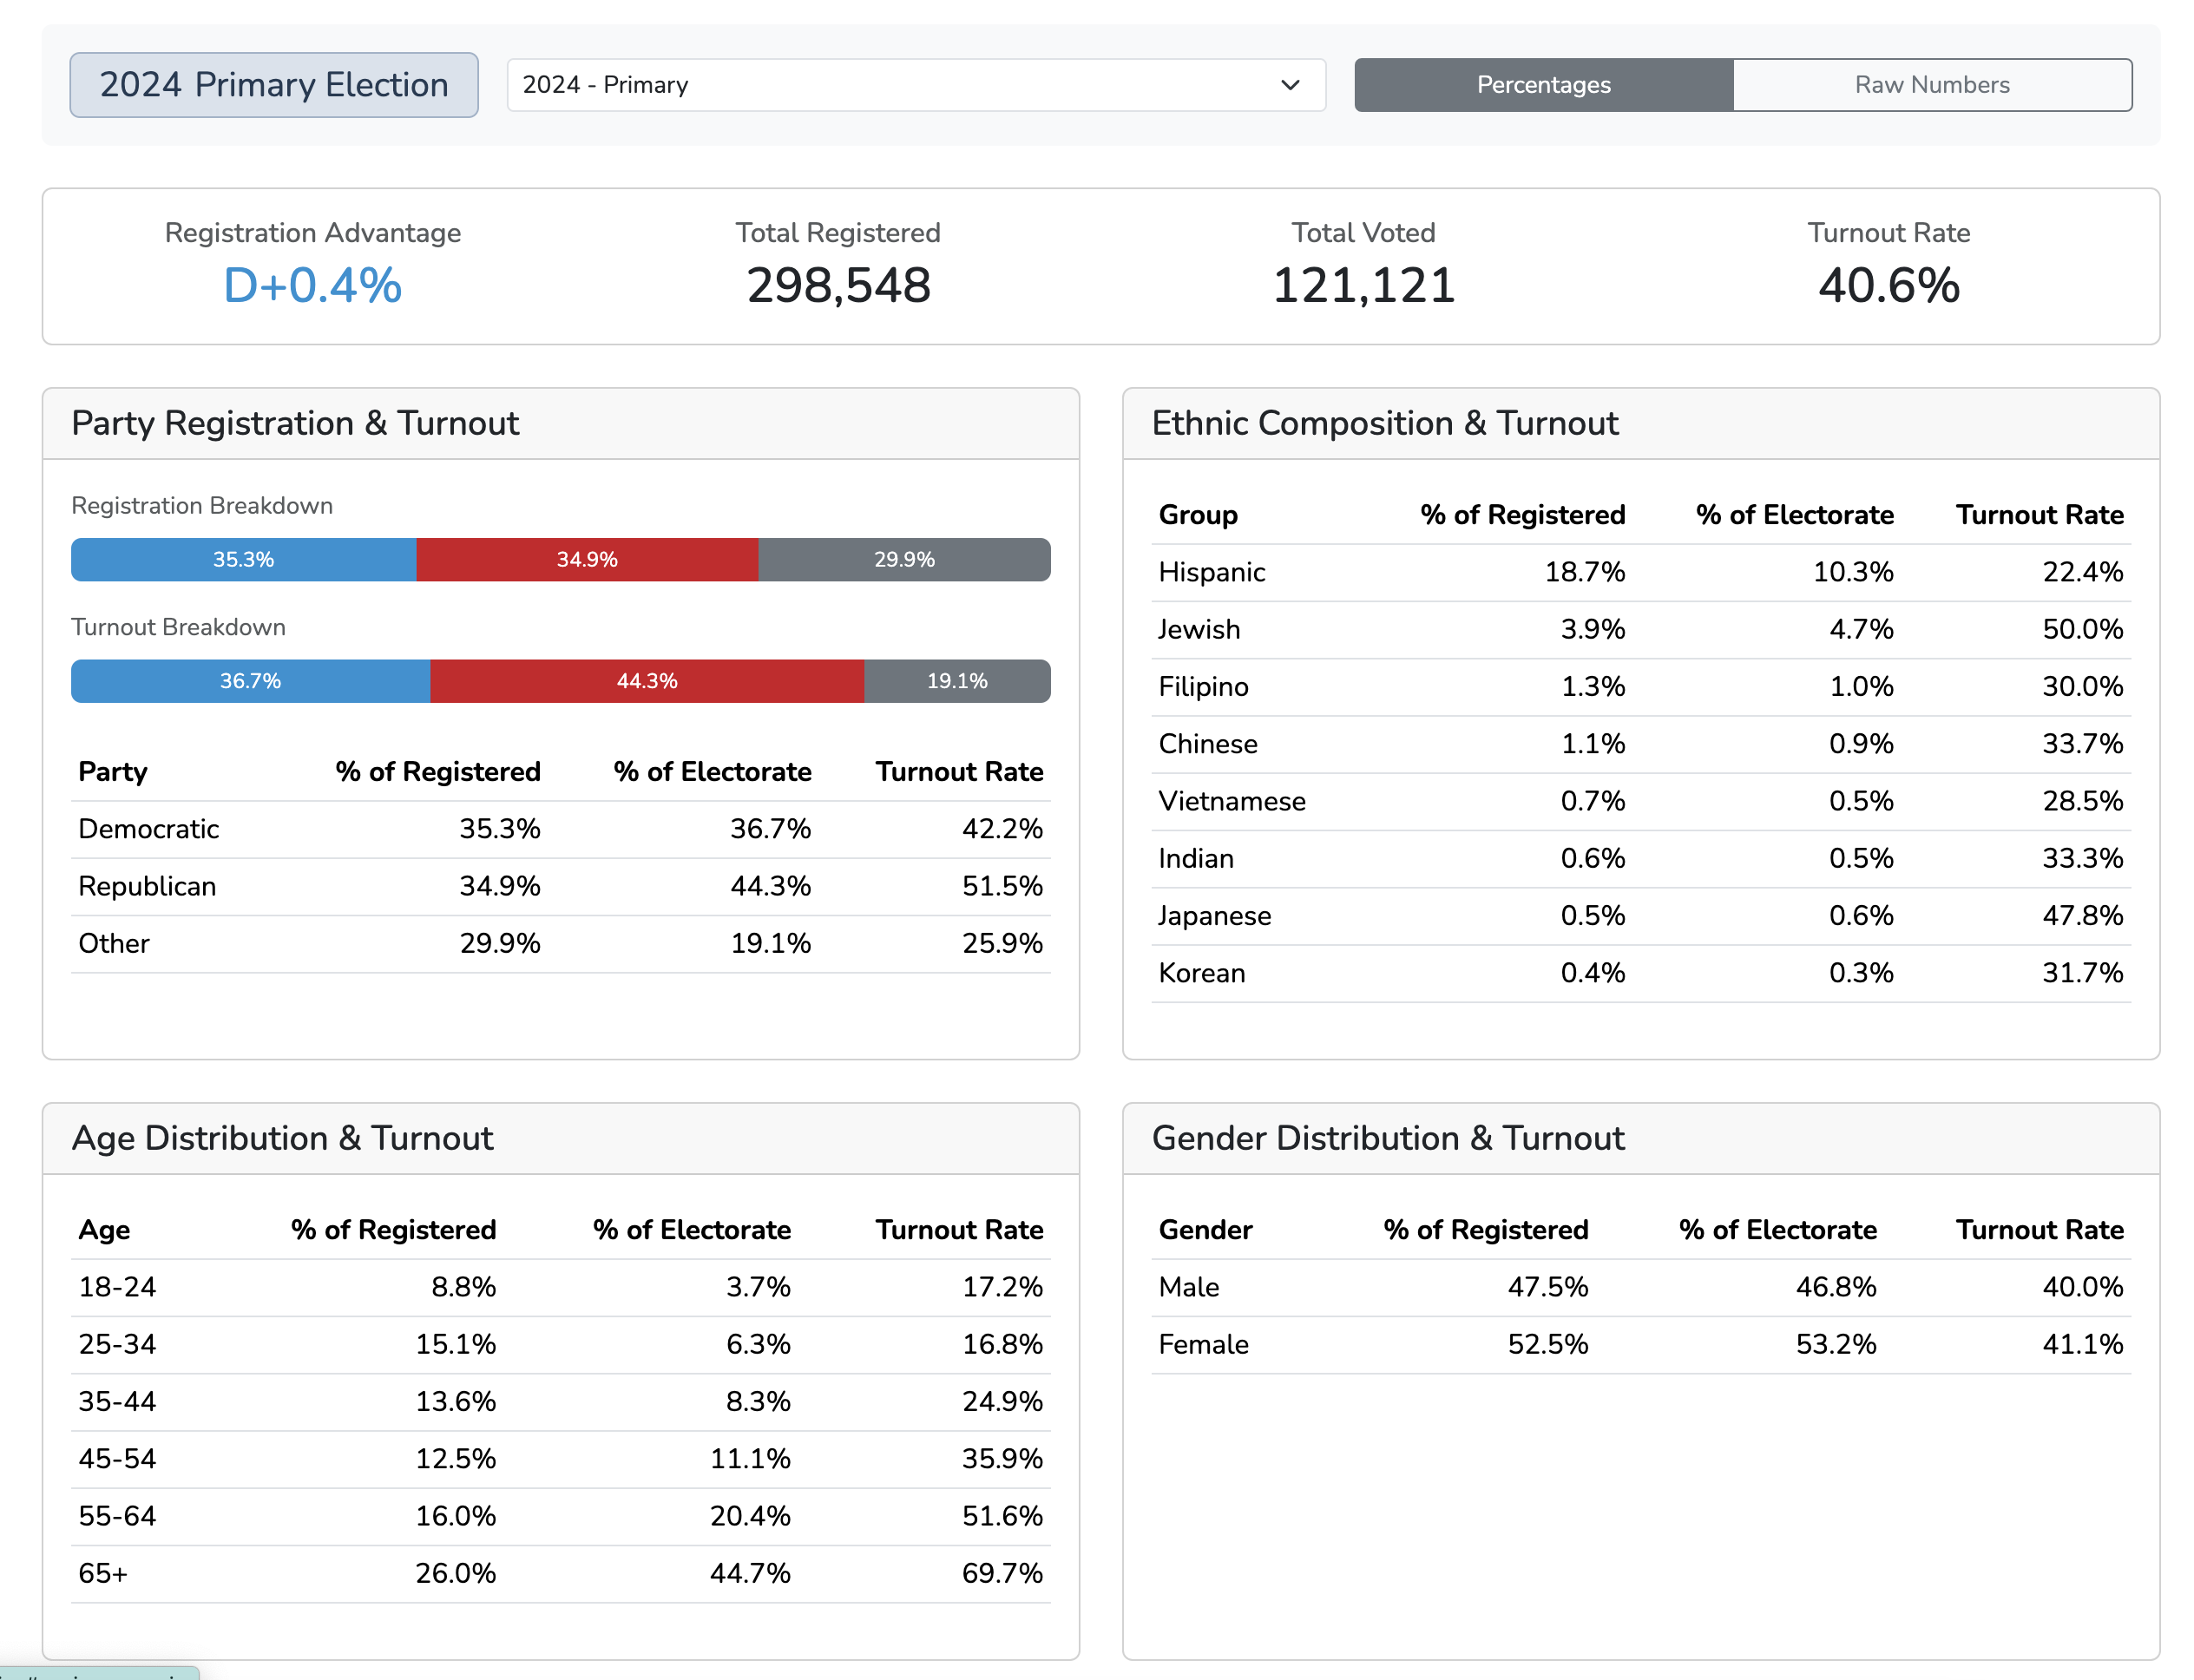
Find Your Winning Coalition
Registration doesn't win elections; turnout does. Pinpoint exactly who shows up in primary, general, and special elections to build a strategy that targets the right voters at the right time.
- Primary vs. general election turnout by party
- Off-year and special election patterns
- Demographic turnout trends over time
- Identify when your coalition is strongest
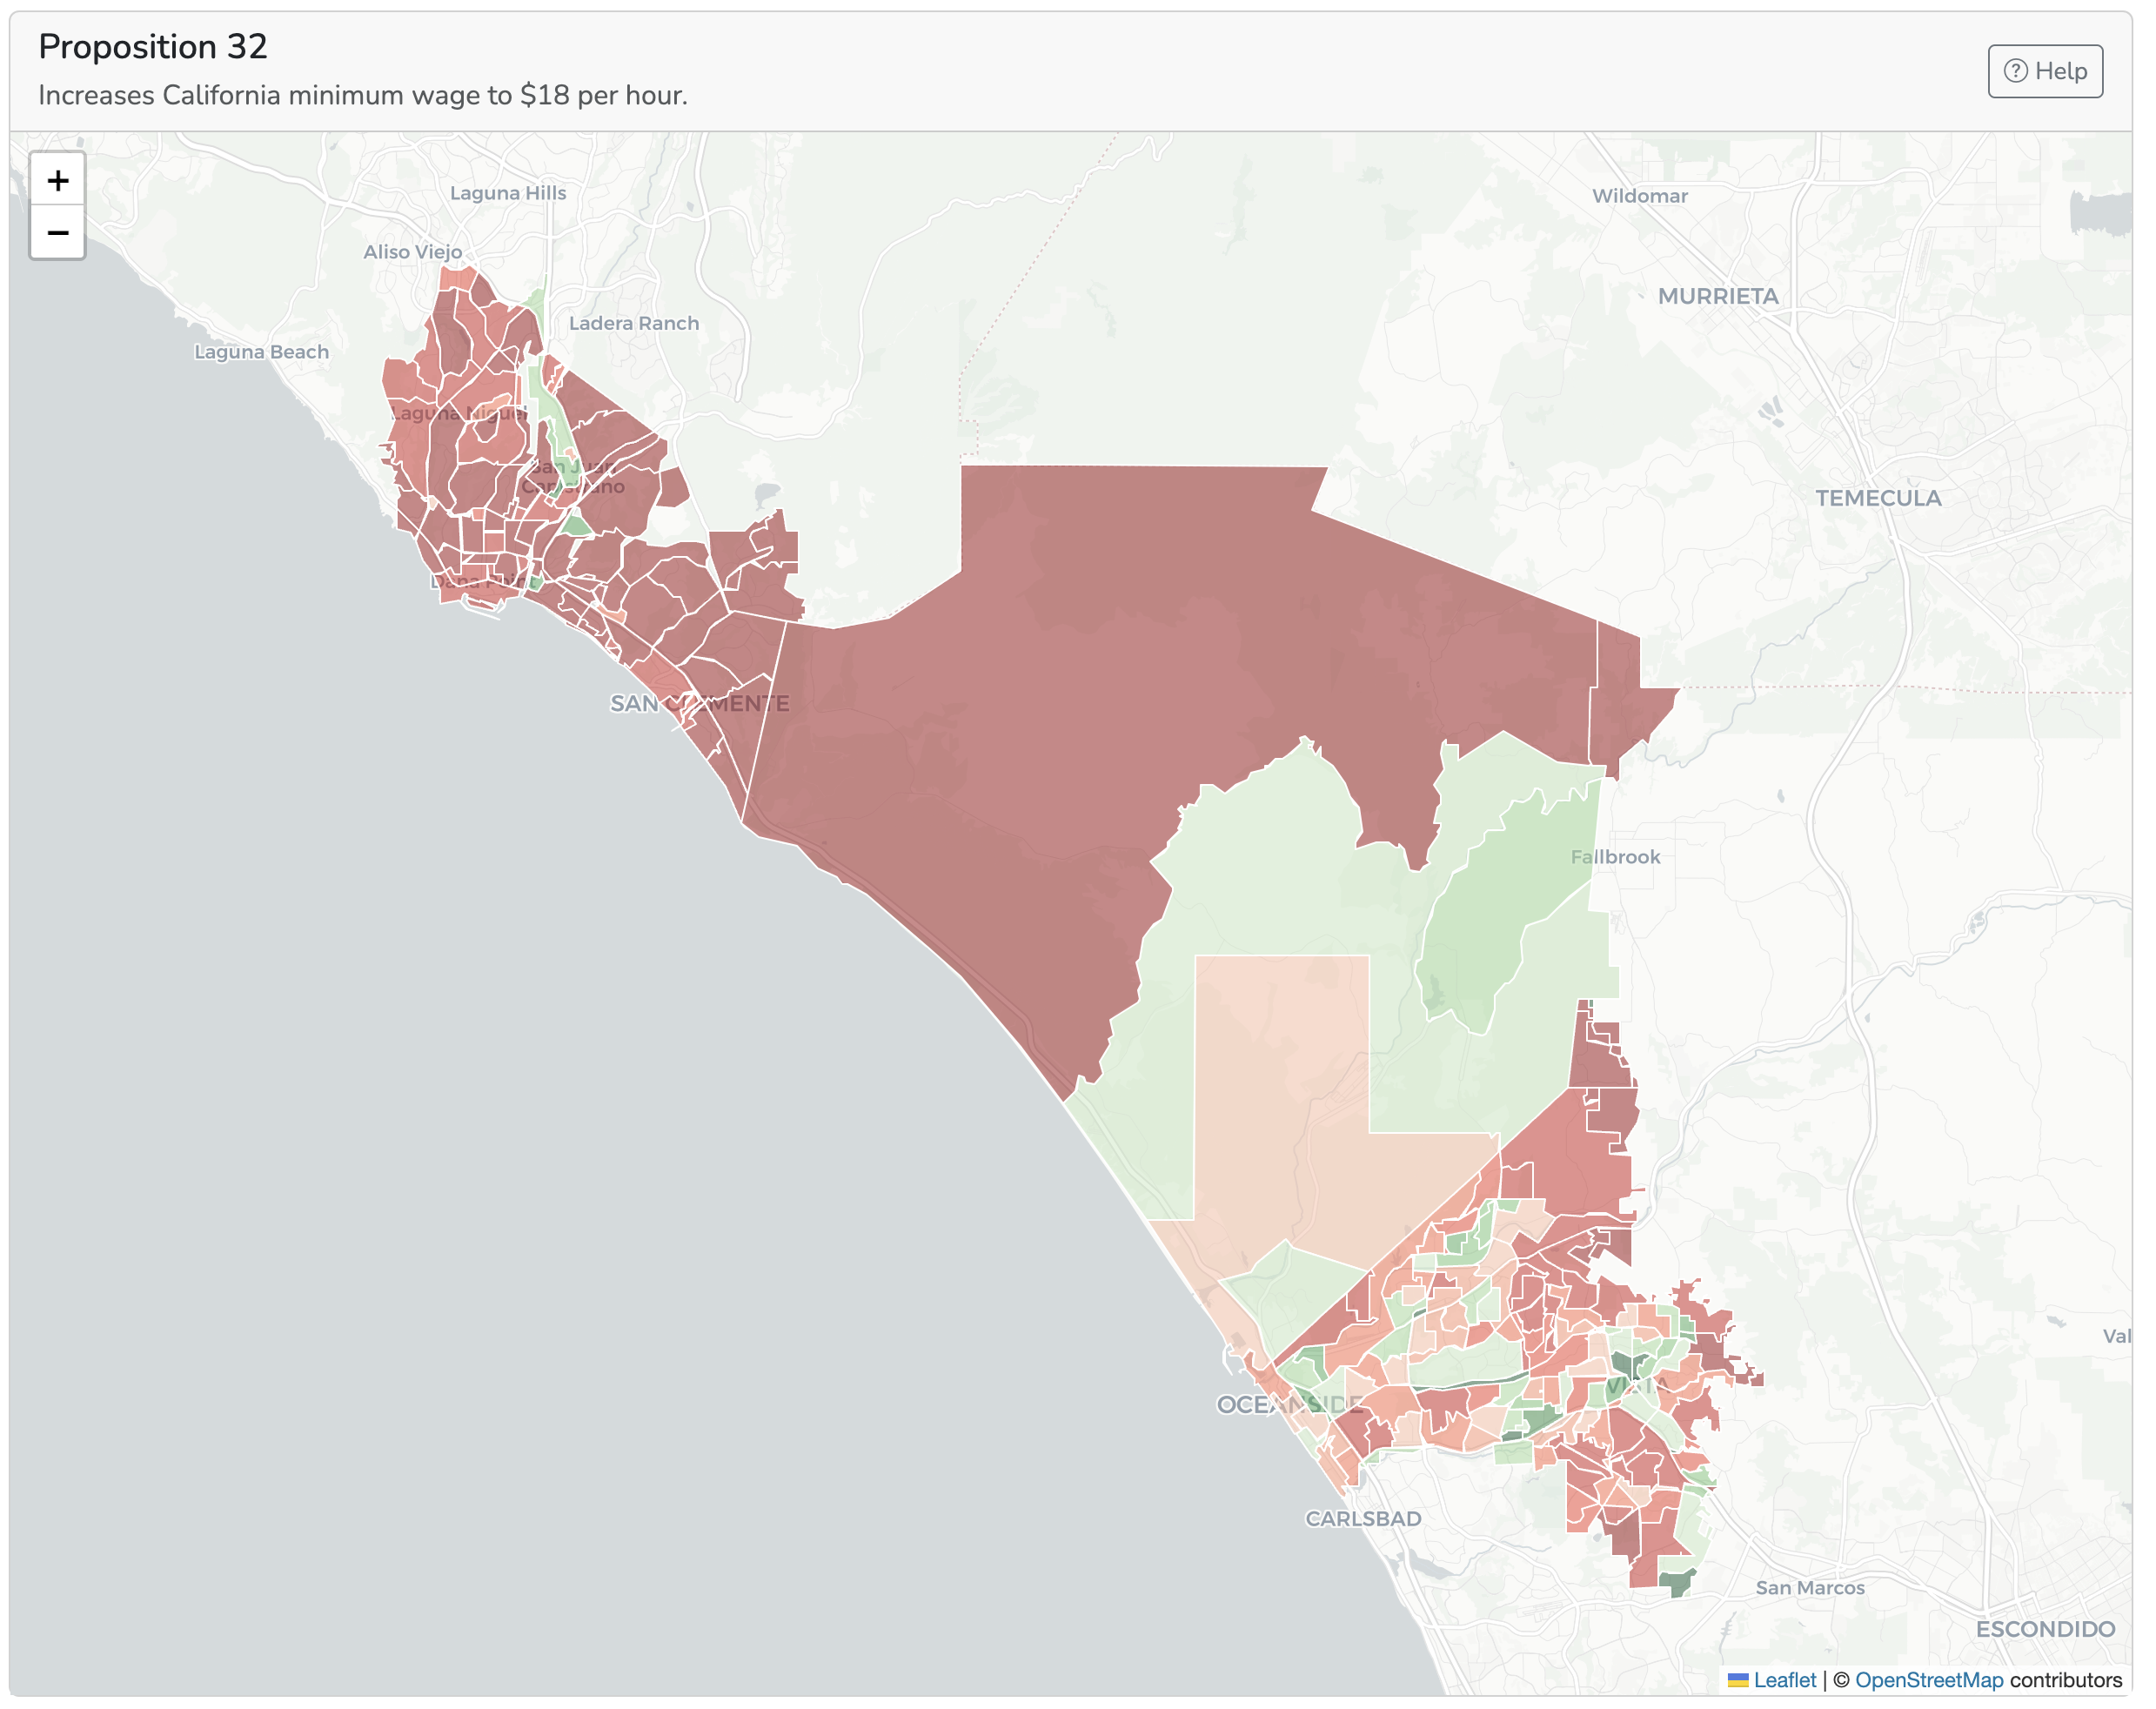
Allocate Resources with Precision
Stop wasting time and money on the wrong areas. Precinct-level maps show you exactly where your base is, where you can persuade voters, and where your opponent is vulnerable.
- Color-coded maps showing vote margins by precinct
- Turnout variations within the district
- Historical performance by neighborhood
- Perfect for field programs and mail targeting
Understand the Nuances That Win Campaigns
Every district has a unique political DNA. Go beyond partisanship to understand the local economic, social, and ideological factors that truly drive voter behavior.
- Ideological scoring based on proposition history
- Demographic trends and projections
- Economic indicators that predict voter behavior
- Cross-jurisdiction overlap analysis
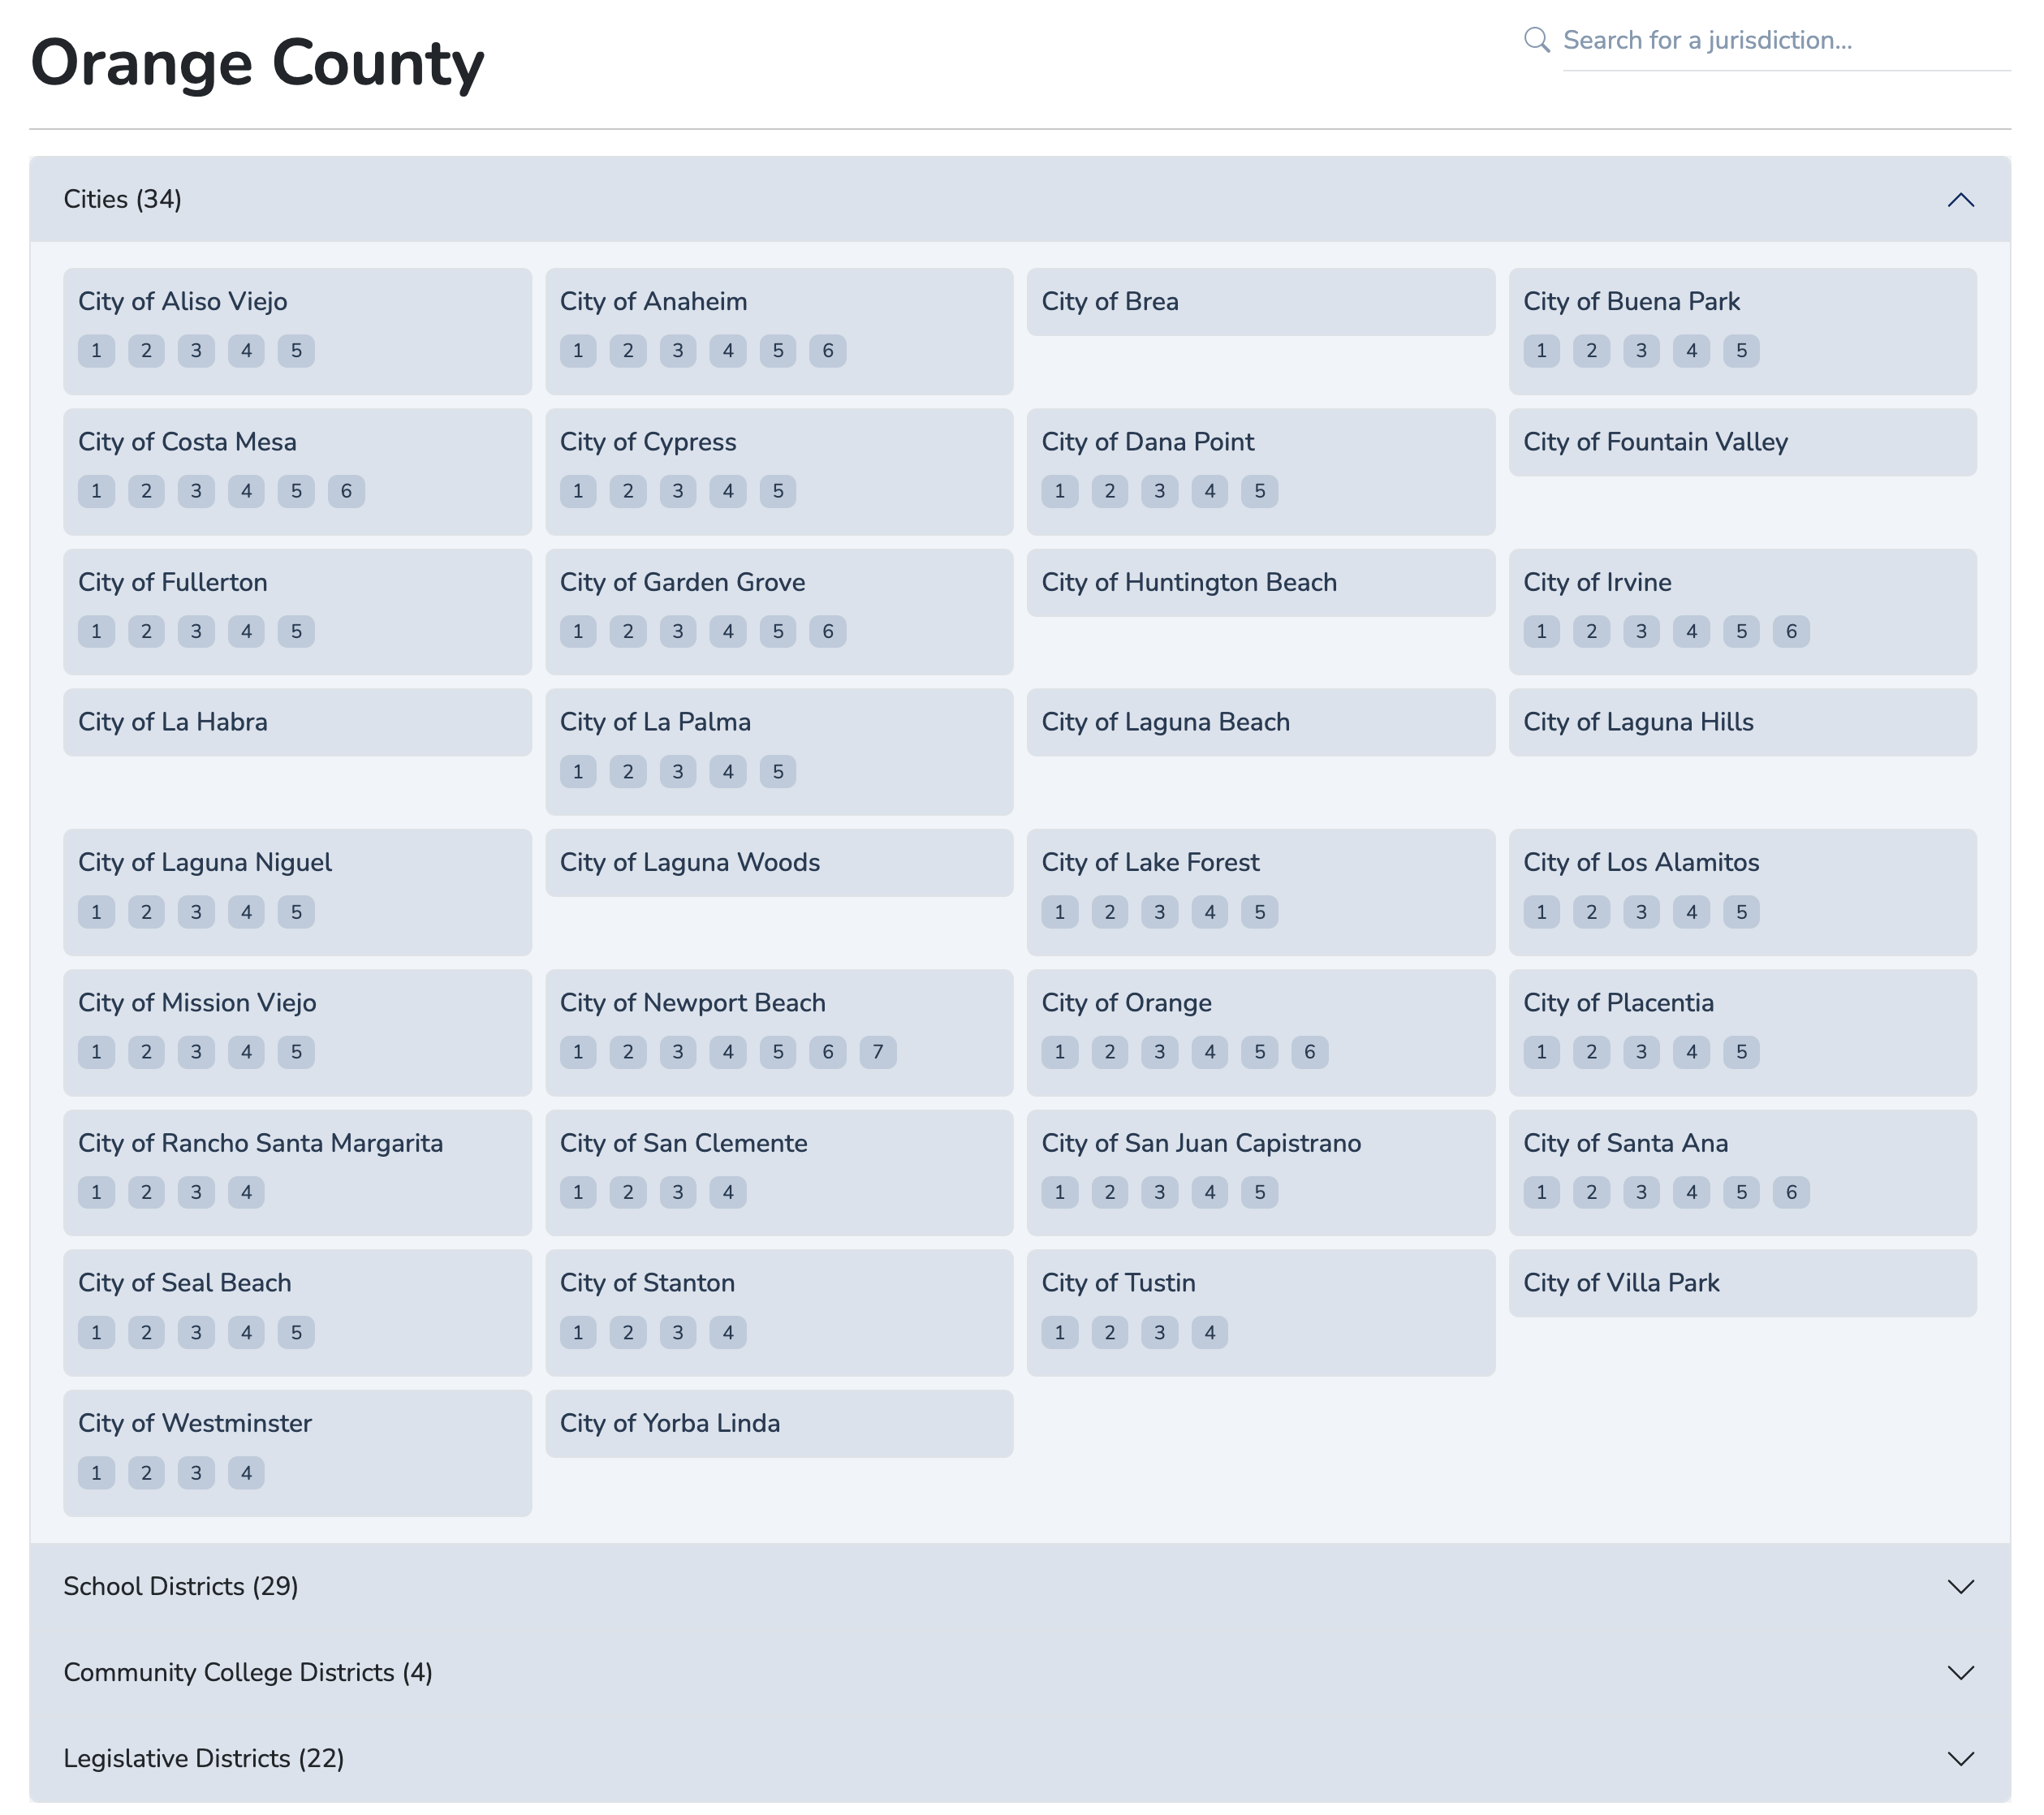
Unparalleled Statewide Coverage
From congressional seats down to city council areas and school board trustee zones, we provide deep, consistent analysis for every jurisdiction. See for yourself.
No matching districts found
Find any district in California instantly
Don't Leave Your Success to Chance
Get the data-driven edge the pros rely on. Start making smarter, more confident political decisions today.
No credit card required • Full access for 14 days