California's Dramatic Shift on Criminal Justice: A Decade of Change
In 2014, California voters passed Proposition 47, a landmark criminal justice reform measure that reduced certain non-violent offenses from felonies to misdemeanors. A decade later, the pendulum has swung dramatically back with Proposition 36 (2024), which reverses key aspects of Prop 47 by increasing penalties for certain theft and drug offenses.
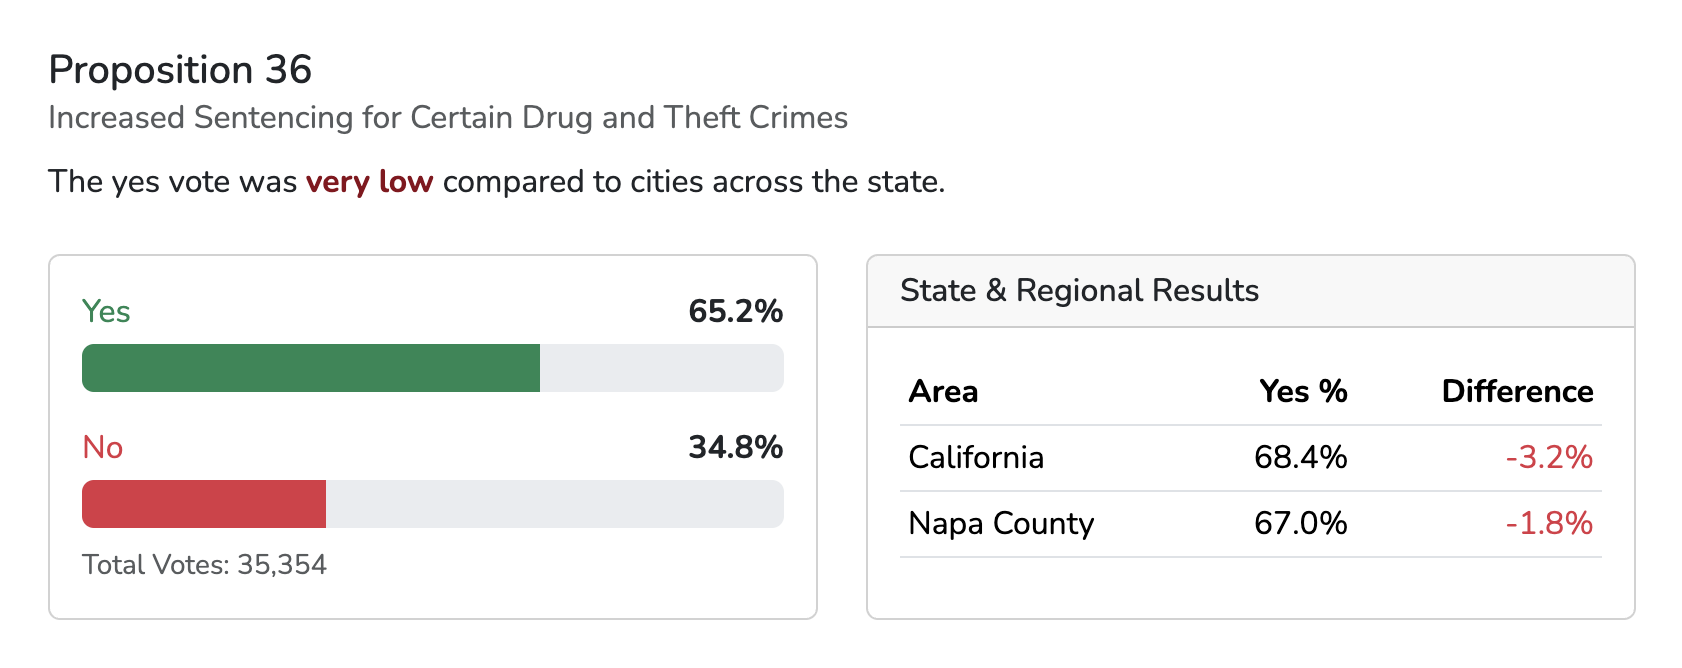
Using comprehensive 2024 election data from The Ballot Book, we've analyzed how California cities have shifted their stance on criminal justice policy over this ten-year span. The results reveal substantial changes in voting patterns across the state.
Understanding the Propositions
Proposition 47 (2014) was labeled the "Safe Neighborhoods and Schools Act." Its key provisions:
- Reclassified certain theft and drug possession offenses from felonies to misdemeanors
- Applied retroactively, allowing resentencing for those serving time for these offenses
- Directed savings from reduced incarceration to mental health and drug treatment programs, K-12 schools, and victim services
Proposition 36 (2024), the "Homelessness, Drug Addiction, and Theft Reduction Act," reverses course:
- Increases penalties for retail theft, including making repeated offenses eligible for felony charges
- Creates new penalties for fentanyl trafficking
- Mandates drug treatment for certain offenders as part of probation or parole
- Allows judges to order treatment before sentencing in appropriate cases
The Shift Across California Cities
Our analysis quantifies the shift between 2014 and 2024 by comparing voting patterns on both propositions. Since a "Yes" on Prop 47 indicated support for reform while a "Yes" on Prop 36 indicates support for stricter policies, we can measure how communities have evolved their thinking on criminal justice.
The calculation compares the percentage of voters supporting "tough on crime" policies in both elections. For Prop 47, this meant "No" votes (opposing reform), while for Prop 36, this meant "Yes" votes (supporting stricter penalties). The difference between these percentages shows how much a city shifted toward tougher crime policies.
Below are the 25 California cities that showed the most significant shifts in criminal justice policy. For the complete dataset of all 468 California cities with populations over 1,000, you can download the file at the bottom of this page:
| Rank | City | County | Population | Prop 47 (2014) Yes % | Prop 36 (2024) Yes % | Shift |
|---|---|---|---|---|---|---|
| 1 | Ross | Marin | 2,338 | 76.67 | 72.89 | 49.56 |
| 2 | Belvedere | Marin | 2,126 | 77.26 | 70.18 | 47.44 |
| 3 | Tiburon | Marin | 9,146 | 77.56 | 69.50 | 47.06 |
| 4 | Sausalito | Marin | 7,269 | 83.07 | 61.51 | 44.58 |
| 5 | San Francisco | San Francisco | 873,965 | 80.09 | 63.86 | 43.95 |
| 6 | Atherton | San Mateo | 7,188 | 70.35 | 73.42 | 43.77 |
| 7 | Larkspur | Marin | 13,064 | 80.22 | 63.49 | 43.71 |
| 8 | Corte Madera | Marin | 10,222 | 80.69 | 62.99 | 43.68 |
| 9 | Beverly Hills | Los Angeles | 32,701 | 68.00 | 75.65 | 43.65 |
| 10 | Calexico | Imperial | 38,633 | 65.72 | 77.87 | 43.59 |
| 11 | Hillsborough | San Mateo | 11,387 | 65.57 | 77.81 | 43.38 |
| 12 | Mill Valley | Marin | 14,231 | 86.64 | 56.18 | 42.82 |
| 13 | Millbrae | San Mateo | 23,216 | 64.08 | 78.24 | 42.32 |
| 14 | Cupertino | Santa Clara | 60,381 | 66.41 | 75.68 | 42.09 |
| 15 | Monte Sereno | Santa Clara | 3,479 | 65.86 | 75.33 | 41.19 |
| 16 | Saratoga | Santa Clara | 31,051 | 63.11 | 77.92 | 41.03 |
| 17 | Yountville | Napa | 3,436 | 70.08 | 70.85 | 40.93 |
| 18 | Foster City | San Mateo | 33,805 | 67.89 | 72.96 | 40.85 |
| 19 | Daly City | San Mateo | 104,901 | 65.39 | 75.40 | 40.79 |
| 20 | Piedmont | Alameda | 11,270 | 77.97 | 62.67 | 40.64 |
| 21 | Burlingame | San Mateo | 31,386 | 70.19 | 69.47 | 39.66 |
| 22 | Hayward | Alameda | 162,954 | 68.68 | 70.54 | 39.22 |
| 23 | Woodside | San Mateo | 5,309 | 72.04 | 67.13 | 39.17 |
| 24 | San Pablo | Contra Costa | 32,127 | 72.93 | 66.24 | 39.17 |
| 25 | South El Monte | Los Angeles | 19,567 | 66.86 | 72.03 | 38.89 |
Key Observations from the Data
The data reveals several notable patterns:
- Regional Concentration: Marin County cities account for 7 of the top 12 positions, with Ross showing the largest shift at 49.56 points.
- Bay Area Prominence: Cities in the San Francisco Bay Area dominate the list, with San Francisco itself showing the fifth-largest shift at 43.95 points.
- Geographic Diversity: While the Bay Area is prominent, cities from Los Angeles, Imperial, and other counties also appear in the top rankings.
Complete Data Access Through The Ballot Book
This analysis was made possible by The Ballot Book's comprehensive 2024 election results database, which now includes complete data for all counties, supervisor districts, cities, and legislative districts in California. Our platform provides detailed results for every statewide ballot proposition, enabling sophisticated analysis of voting patterns like this one. Interested in exploring this data yourself? Sign up for a free trial of The Ballot Book to access our complete election database and analytics tools.
The Ballot Book's proposition analysis feature allows users to compare results across jurisdictions, revealing how different communities vote on critical issues like criminal justice reform.
Complete dataset: You can download the full analysis of all 468 California cities with populations over 1,000 using the form below.
Get the Complete Dataset
Get "Prop 47 to Prop 36 Shift by City" delivered directly to your email.
Find this analysis helpful?
Get more California political insights and data-driven analysis delivered to your inbox.